Key takeaways
- EOQ = √(2 × annual demand × cost per order ÷ holding cost per unit per year).
- Ordering cost falls as orders get bigger and holding cost rises; EOQ is the order size where the two are equal and their total is lowest.
- Holding cost is often 15% to 30% of unit cost a year once you count storage, insurance, damage, obsolescence and the cost of tied-up cash.
- The total cost curve is flat near the EOQ: ordering 10% more or less adds well under 1% to cost, so round to cases or pallets freely.
- EOQ says how much to order. A reorder point says when. Minimum order quantities, volume discounts and seasonal sales all need an adjustment.
The trade-off EOQ solves
Every time you place an order, it costs you something regardless of how much you buy: your time to raise it, the supplier’s flat delivery charge, the time to check it in and pay the bill. Order small and often, and those costs pile up.
Order big and rarely, and you have the opposite problem. More stock sits on the shelf for longer, and stock costs money to hold: space, insurance, damage, items going out of date, and the cash you could be using elsewhere.
Economic order quantity is the order size that balances the two. It is a 1913 formula from operations research, still taught because it gives a sensible starting point with only three inputs.
EOQ = √(2 × D × S ÷ H) D = annual demand in units S = cost to place and receive one order H = cost to hold one unit for a year
Free toolEOQ calculator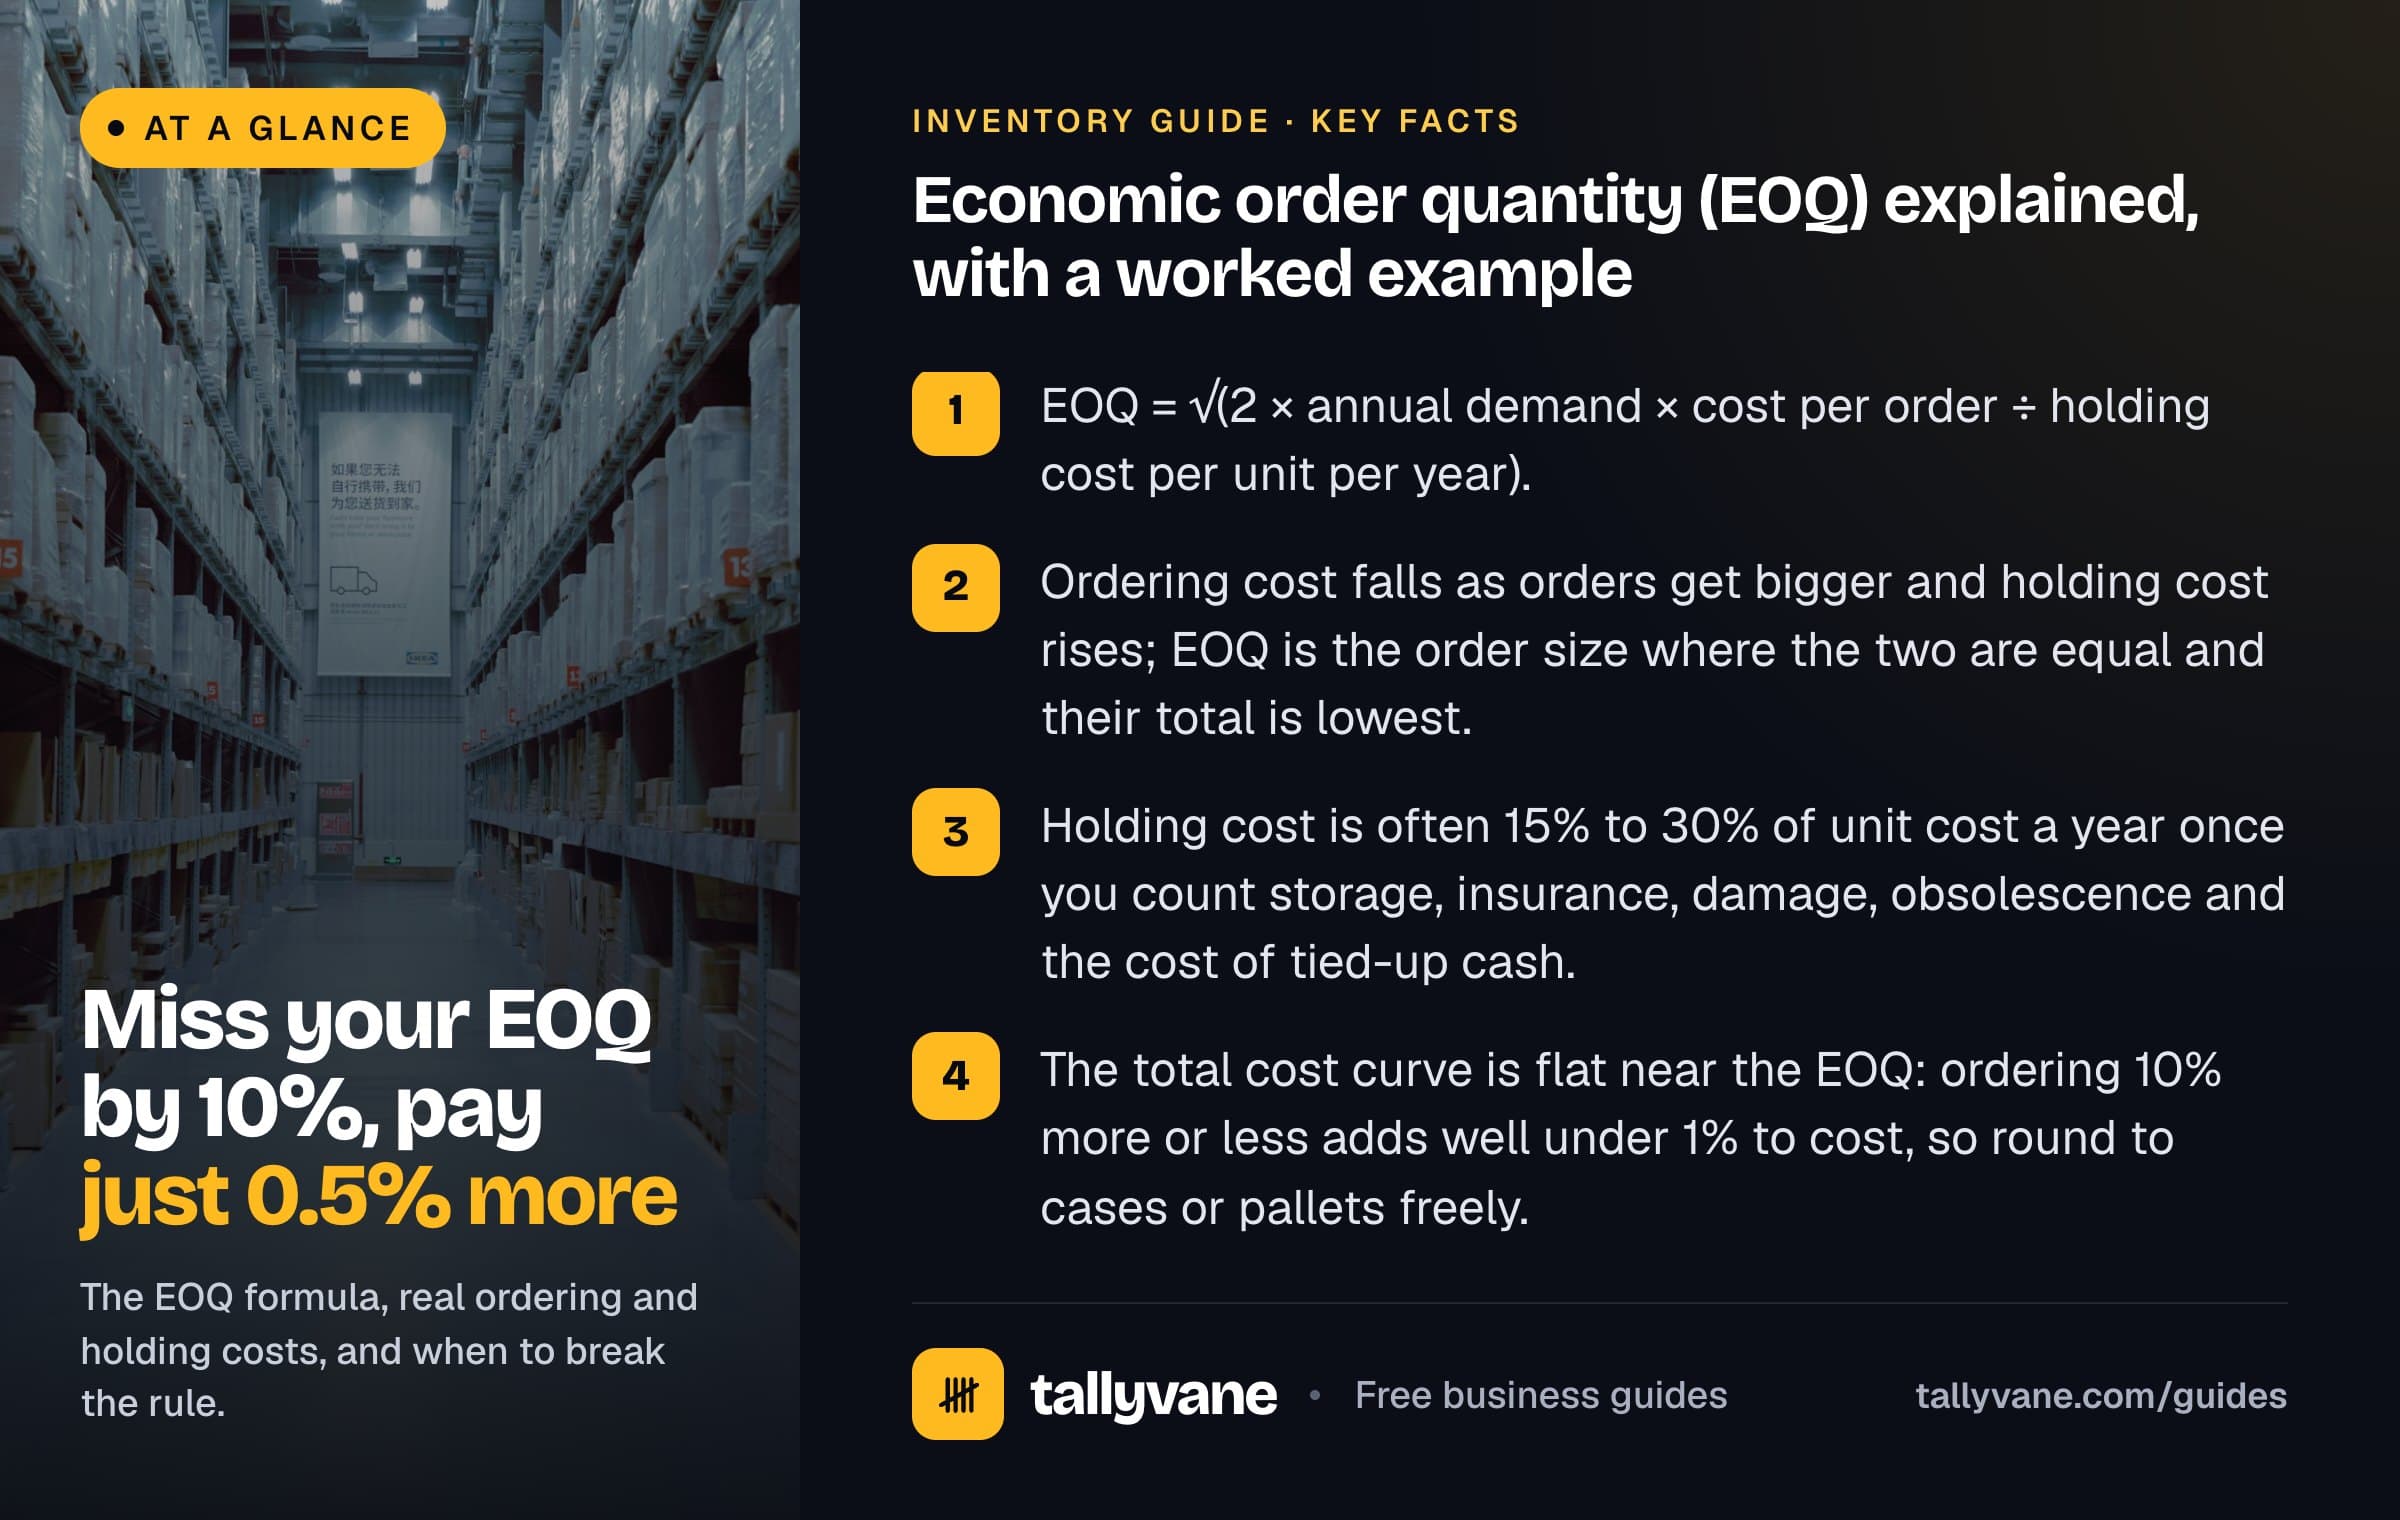
Where the formula comes from
If you order Q units at a time, you place D ÷ Q orders a year, so annual ordering cost is (D ÷ Q) × S. Stock runs down from Q to zero between deliveries, so on average you hold Q ÷ 2 units, and annual holding cost is (Q ÷ 2) × H.
Add the two and you have total annual inventory cost. Ordering cost shrinks as Q grows; holding cost grows in a straight line. The total is lowest exactly where the two are equal. Set (D ÷ Q) × S equal to (Q ÷ 2) × H, solve for Q, and you get the EOQ formula.
That gives you a quick check on any order size. If your yearly ordering cost is much bigger than your yearly holding cost, you order too often. If holding cost is much bigger, you order too much at a time.
Annual ordering cost = (D ÷ Q) × S Annual holding cost = (Q ÷ 2) × H Total cost = (D ÷ Q) × S + (Q ÷ 2) × H At the EOQ: ordering cost = holding cost
Estimating ordering and holding costs for a small business
The formula is only as good as S and H, and few small businesses have them written down. You can build both from things you already know.
Ordering cost covers everything that happens once per order. Time yourself raising a purchase order, chasing it, checking the delivery and paying the invoice, and price that time at what you pay staff or value your own hour. Add any flat charge per order: a delivery or freight fee that does not change with quantity, a handling or admin fee, a customs broker’s fee per shipment. Leave out the price of the goods and any freight charged per unit.
Holding cost covers everything that grows with the amount of stock you keep. It is usually easier to estimate as a percentage of unit cost per year and add up the parts.
- Cost of capital: the interest on the overdraft or loan that funds your stock, or the return you could earn on the cash. Often 5% to 10%.
- Storage: rent or warehouse fees for the space stock takes up, plus utilities. If you pay per pallet or per cubic metre, use that.
- Insurance on stock, often a few percent of its value.
- Shrinkage, damage and obsolescence: items lost, broken, expired or no longer sellable. High for fashion, food and electronics.
- Many businesses land between 15% and 30% a year in total. If you are unsure, run the numbers at both ends and see how much the EOQ moves.
Worked example: an online candle shop
A candle shop sells 4,800 candles a year, about 400 a month. Each candle costs $8 from the supplier. Placing an order takes about 40 minutes of admin and receiving and checking it takes another 30, both valued at $30 an hour, so $35 of time. The supplier adds a flat $25 delivery charge per order. Ordering cost is $60.
For holding cost, the shop counts 8% for the cost of the cash, 10% for its share of a rented storage unit, 2% for insurance and 5% for damage and unsold scents: 25% of $8, or $2 per candle per year.
EOQ = √(2 × 4,800 × $60 ÷ $2) = √288,000 ≈ 537 candles. That is about 9 orders a year, one every 41 days or so. The table shows the yearly cost at order sizes on either side.
- At the EOQ the ordering and holding costs are almost exactly equal, as the formula says they should be.
- The curve is flat near the bottom. Ordering 483 or 591 candles, 10% either side, adds about 0.5% to the yearly cost. Rounding to a case of 24 or 48 costs almost nothing.
- It is steep at the edges. Ordering 200 at a time costs $567 a year more than the EOQ; ordering 1,500 costs $619 more.
| Order size | Orders a year | Days between orders | Ordering cost | Holding cost | Total cost |
|---|---|---|---|---|---|
| 200 | 24.0 | 15.2 | $1,440.00 | $200.00 | $1,640.00 |
| 300 | 16.0 | 22.8 | $960.00 | $300.00 | $1,260.00 |
| 400 | 12.0 | 30.4 | $720.00 | $400.00 | $1,120.00 |
| 537 (EOQ) | 8.9 | 40.8 | $536.31 | $537.00 | $1,073.31 |
| 700 | 6.9 | 53.2 | $411.43 | $700.00 | $1,111.43 |
| 1,000 | 4.8 | 76.0 | $288.00 | $1,000.00 | $1,288.00 |
| 1,500 | 3.2 | 114.1 | $192.00 | $1,500.00 | $1,692.00 |
The assumptions, and when EOQ breaks
The basic model assumes steady demand all year, fixed ordering and holding costs, one unit price whatever the order size, and each order arriving in full and on time. Real suppliers rarely cooperate on all of these. Here is how to adjust for the common cases.
- Minimum order quantity: if the supplier will not ship fewer than its minimum and the minimum is above your EOQ, order the minimum. The cost penalty is often small because the curve is flat; in the example, a 1,000-unit minimum adds $215 a year.
- Volume discounts: the basic formula ignores price, so compare total yearly cost including the goods. If the candle supplier gave 2% off orders of 1,000 or more, purchases would drop from $38,400 to $37,632. Total cost at 1,000 would be $38,900, against $39,473 at the EOQ, so the bigger order wins by about $573 a year, provided you have the cash and space.
- Seasonality: EOQ uses an annual average. If you sell three times as much in November and December, run the calculation separately for peak and off-peak periods with each period’s demand turned into a yearly rate.
- Perishable or fast-changing stock: if items expire or go out of fashion before you can sell an EOQ’s worth, the shelf life caps your order size.
- Cash and space limits: EOQ assumes you can fund and store any quantity. If you cannot, the real constraint is your bank balance or your shelves.
How EOQ pairs with a reorder point
EOQ tells you how much to order. It does not tell you when. For that you need a reorder point: the stock level that triggers a new order so it arrives before you run out.
For the candle shop, average demand is 4,800 ÷ 365, about 13 candles a day. If the supplier takes 14 days from order to delivery, the shop needs about 184 candles on hand when it orders, plus safety stock for busy weeks or late deliveries. The working rule becomes: when stock falls to the reorder point, order about 537.
Our reorder point and safety stock guide covers that side in detail, including how to size the safety buffer.
Reorder point = (Average daily demand × Lead time in days) + Safety stock
Free toolReorder point calculatorChecking the result against your stock turnover
Once you are ordering near the EOQ, your average stock is roughly half the order size plus any safety stock. For the candle shop that is about 269 candles before safety stock, or about $2,150 at cost. Compare it with what you hold today: if you currently keep two or three months of stock on hand, moving to EOQ-sized orders frees up cash.
Inventory turnover shows the effect over a year. Cost of goods sold of $38,400 against average inventory of about $2,150 is a turnover near 18 times a year, before safety stock. Recalculate EOQ when demand, supplier charges or storage costs change, and at least once a year.
Free toolInventory turnover calculator