Key takeaways
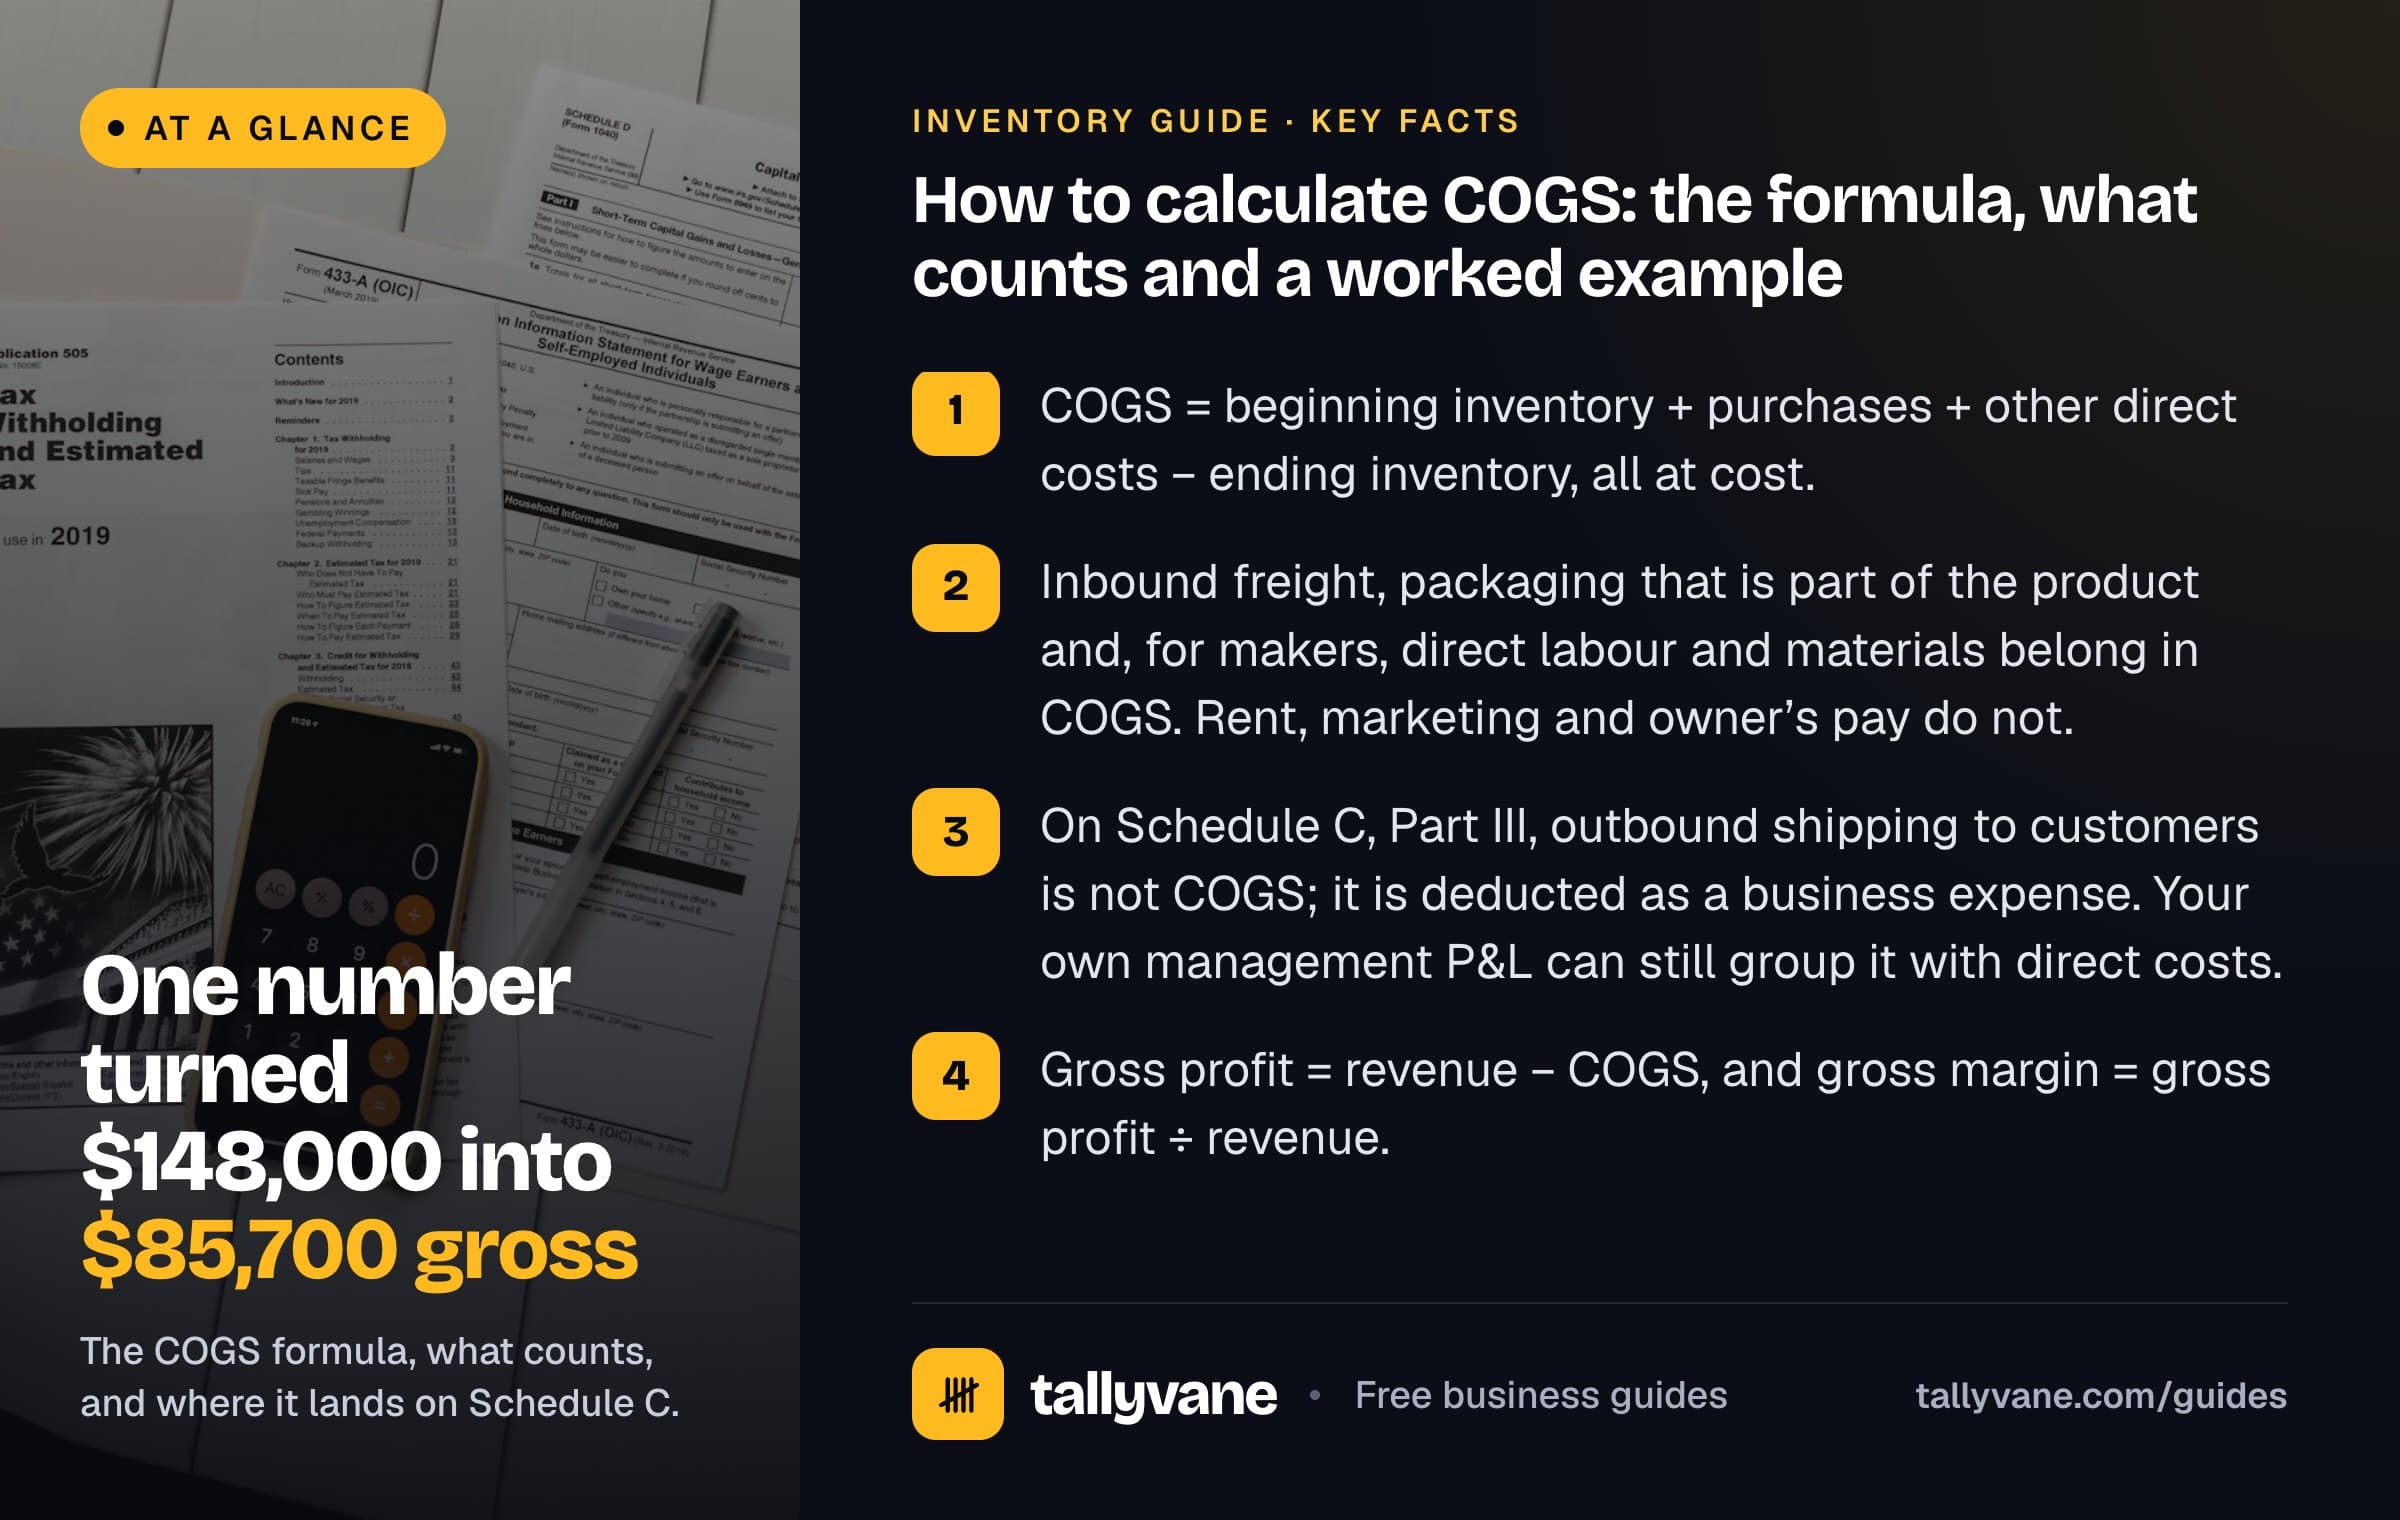
- COGS = beginning inventory + purchases + other direct costs − ending inventory, all at cost.
- Inbound freight, packaging that is part of the product and, for makers, direct labour and materials belong in COGS. Rent, marketing and owner’s pay do not.
- On Schedule C, Part III, outbound shipping to customers is not COGS; it is deducted as a business expense. Your own management P&L can still group it with direct costs.
- Gross profit = revenue − COGS, and gross margin = gross profit ÷ revenue.
The COGS formula
COGS is the cost of the stock that left your business through sales during a period. You rarely know that number directly, so you work it out from what you started with, what you added and what is left.
Everything is measured at cost: what you paid suppliers, not what customers pay you. The period is usually your tax year, but the same formula works for a month or a quarter if you have stock values for those dates.
COGS = Beginning inventory + Purchases + Other direct costs − Ending inventory Gross profit = Revenue − COGS Gross margin % = Gross profit ÷ Revenue × 100
Where each number comes from
Beginning inventory is last period’s ending inventory. Do not recount it: use the figure from last year’s accounts or tax return, so nothing falls through the gap between years.
Purchases are the cost of stock bought for resale in the period, less trade discounts, returns to suppliers and anything you took out for personal use. Add freight-in, the cost of getting goods to you, because IRS guidance treats it as part of the cost of the goods.
Ending inventory comes from your count on the last day of the period, valued at cost. That count is where most COGS errors start. Our guide to the year-end inventory count covers cut-off, goods in transit, valuation methods and write-downs for damaged stock.
What counts as COGS, and what does not
For a reseller, COGS is mainly the stock itself. For a maker, it also includes the raw materials and the labour that goes into each product. IRS Publication 334 lists containers that are part of the product, freight-in and, for producers, overhead tied to production. It also says not to include anything you pay yourself as labour.
Costs of running and selling the business are operating expenses, not COGS, even if they rise with sales. On Schedule C, outbound shipping to customers, marketplace and card fees, advertising and rent are deducted in Part II.
| Cost | COGS (Part III) | Expense (Part II) |
|---|---|---|
| Stock bought for resale | Yes | |
| Freight-in from suppliers, import duty | Yes | |
| Raw materials (makers) | Yes | |
| Wages of staff who make the product | Yes | |
| Packaging that is part of the product, such as a candle jar | Yes | |
| Shipping orders to customers, mailers | Yes | |
| Marketplace, card and payment fees | Yes | |
| Advertising and marketing | Yes | |
| Rent of a shop or office (resellers) | Yes | |
| Owner’s drawings or pay to yourself | No | No |
Shipping and fees: tax return vs your own P&L
Many online sellers like to see every cost that comes with an order in one place: the product, the mailer, postage and the marketplace fee. Our profit and loss statement generator lets you do that by listing them under cost of goods sold, which gives a gross margin closer to what each order really earns.
That is fine for your own management accounts, as long as you are consistent. For your tax return, keep the IRS split. Part III of Schedule C should hold inventory, purchases, labour, materials and other production costs. Postage to customers and selling fees belong in Part II. The total deduction is the same either way; what changes is your reported gross profit.
Free toolProfit and loss statement generatorPeriodic vs perpetual inventory
Under a periodic system you do not track the cost of each sale. You count stock at the end of the period and use the formula above to work out COGS in one go. It suits small sellers with simple ranges and spreadsheets.
Under a perpetual system, your stock or e-commerce software records the cost of each item as it sells, so COGS builds up through the year and you can see gross margin every week. You still count, because records drift from reality through theft, damage and mis-picks. The count adjusts the books, and any shortfall ends up in COGS.
Both systems need a cost-flow method, such as FIFO or weighted average, to decide which purchase price applies to each unit sold. The method you choose changes COGS when your buying prices move, so use one method consistently.

Worked example: a home goods reseller for one year
A sole proprietor selling home goods online had $18,500 of stock at cost on 1 January. During the year she bought $62,400 of stock, paid $3,100 in freight and import charges to get it to her, and took $400 of stock home for personal use. Her year-end count valued closing stock at $21,300. Sales for the year, after refunds, were $148,000.
- Each dollar added to closing stock would cut COGS by a dollar and raise taxable profit by a dollar, which is why the count matters.
- Her shipping to customers and marketplace fees are not in this table. They go in Part II and reduce net profit, not gross profit.
- Average inventory was ($18,500 + $21,300) ÷ 2 = $19,900, so stock turned over $62,300 ÷ $19,900 = about 3.1 times in the year, roughly every 117 days.
| Line | Schedule C line | Amount |
|---|---|---|
| Inventory at beginning of year | 35 | $18,500 |
| Purchases ($62,400) less personal use ($400) | 36 | $62,000 |
| Cost of labour | 37 | $0 |
| Materials and supplies | 38 | $0 |
| Other costs: freight-in and import charges | 39 | $3,100 |
| Total goods available for sale | 40 | $83,600 |
| Inventory at end of year | 41 | −$21,300 |
| Cost of goods sold (to line 4) | 42 | $62,300 |
| Revenue | $148,000 | |
| Gross profit | $85,700 | |
| Gross margin | 57.9% |
How COGS feeds gross margin and your tax return
COGS is the first cost on a profit and loss statement. Revenue minus COGS is gross profit, and gross profit as a share of revenue is gross margin. If your gross margin is falling, the cause is in your prices, discounts, supplier costs or product mix, not your overheads.
Check the overall figure against your pricing. A product that costs $42 landed and sells for $100 has a 58% margin, which matches the reseller above. If your product-level margins are much higher than the margin from your COGS formula, look for discounts, write-offs or shrinkage you have not priced in.
On Schedule C, line 42 of Part III carries to line 4, where it is subtracted from gross receipts. Line 33 asks how you value closing inventory: cost, lower of cost or market, or another method. Small businesses with average annual gross receipts of $32 million or less over the three prior years, for tax years beginning in 2026, can choose simpler inventory treatment for tax, but most product sellers still work out COGS this way for their own books.
Margin % = (Price − Cost) ÷ Price × 100 Example: ($100 − $42) ÷ $100 × 100 = 58%
Free toolProfit margin calculator