
Key takeaways
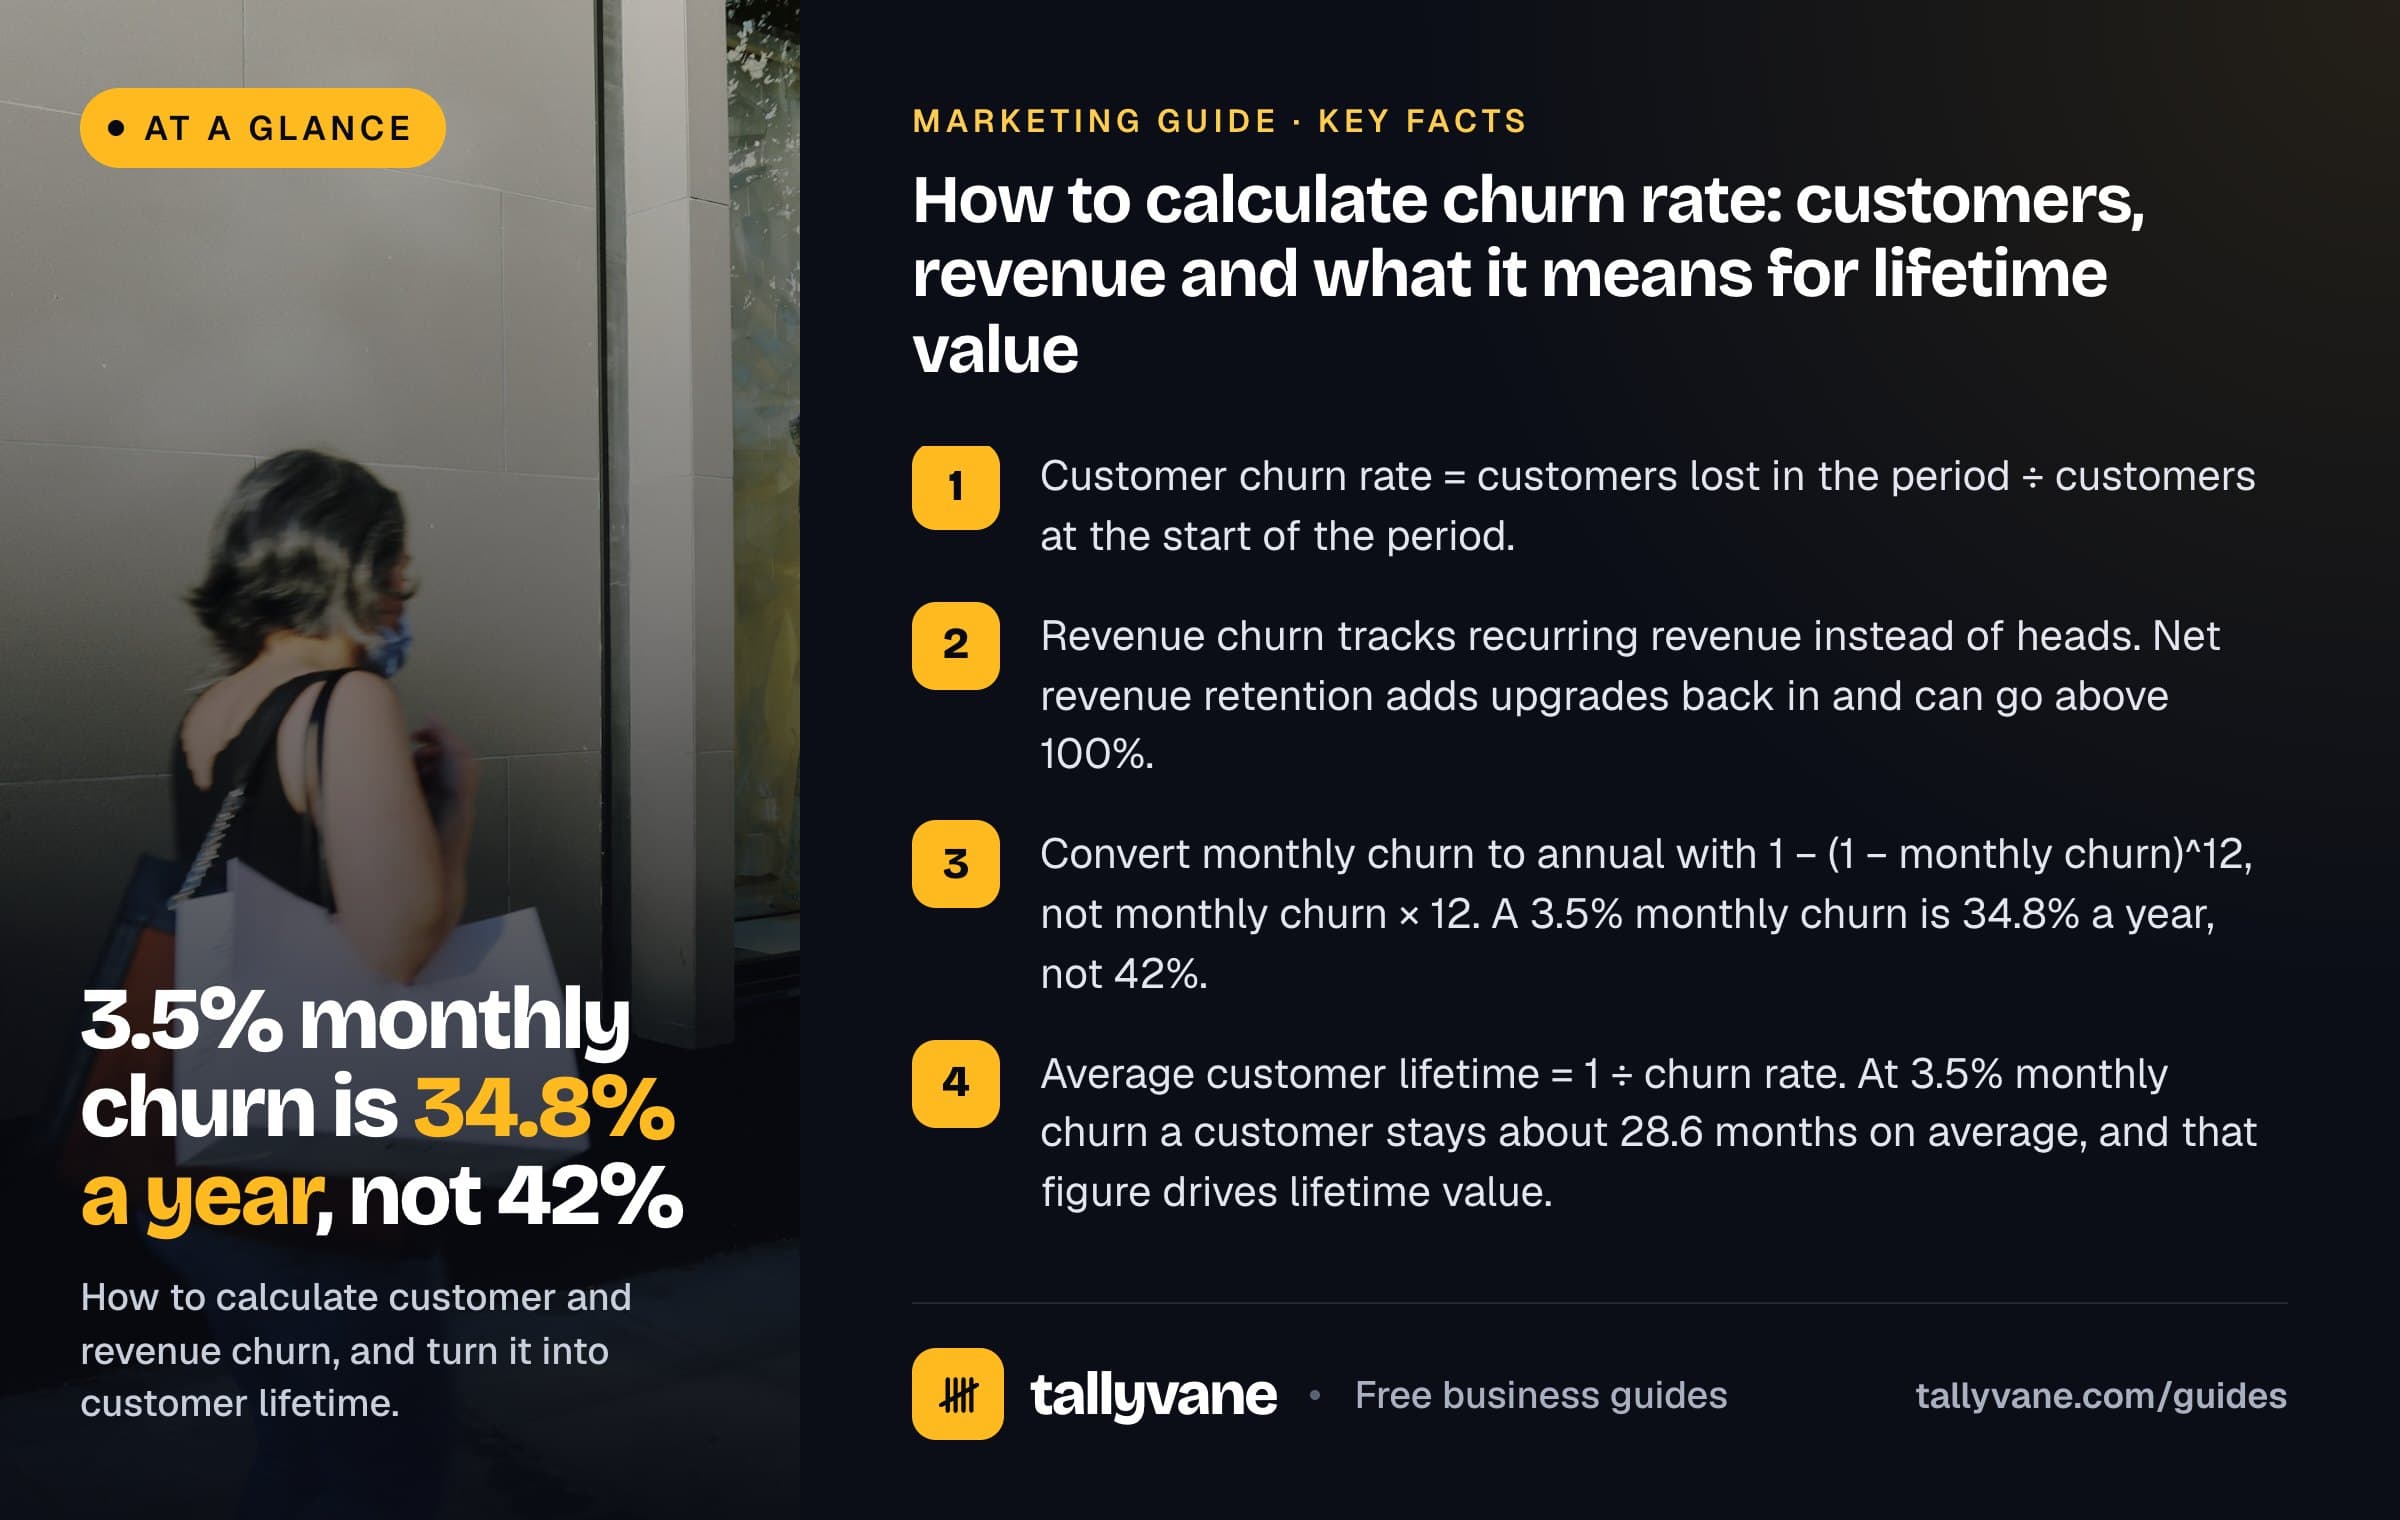
- Customer churn rate = customers lost in the period ÷ customers at the start of the period.
- Revenue churn tracks recurring revenue instead of heads. Net revenue retention adds upgrades back in and can go above 100%.
- Convert monthly churn to annual with 1 − (1 − monthly churn)^12, not monthly churn × 12. A 3.5% monthly churn is 34.8% a year, not 42%.
- Average customer lifetime = 1 ÷ churn rate. At 3.5% monthly churn a customer stays about 28.6 months on average, and that figure drives lifetime value.
What churn rate measures
Churn is the rate at which customers stop paying you. It matters most for businesses with recurring revenue: software subscriptions, subscription boxes, memberships, retainers and service plans. Every customer you keep is revenue you do not have to win again with ad spend.
There are two kinds of churn, and they answer different questions. Customer churn counts people or accounts: how many left? Revenue churn counts money: how much recurring revenue left? If your smallest customers cancel and your largest stay, customer churn looks bad while revenue churn looks fine. Track both.
Pick one period and stick to it. Monthly churn suits businesses billed monthly. If most customers pay once a year, measure churn yearly, because a customer on an annual plan cannot cancel in most months.
How to calculate customer churn rate
Count the customers you had at the start of the period. Count how many of those customers cancelled or stopped paying by the end of it. Divide the second number by the first.
Decide what counts as a lost customer before you start, and write it down. A customer who drops from two subscriptions to one has not churned; a customer who cancels everything has. Also decide when a cancellation counts. Stripe Billing, for example, lets you count churn on the day a customer cancels or at the end of the billing period they have already paid for. Either is fine if you never switch between them.
Failed payments need a rule too. Many businesses only count one as churn once their payment retry period ends, so a card that is updated a few days later does not count as a loss and a win.
Customer churn rate = Customers lost in the period ÷ Customers at the start of the period × 100 Retention rate = 100% − Churn rate
Customers who join, and leave, mid-period
The simple formula assumes nobody joined during the month. In real life new customers arrive every day, and a few of them cancel before the month is out. Where you put them changes the answer.
Take a small booking app for hair salons. It starts October with 400 paying customers, wins 50 new ones during the month and loses 17: 14 who were customers on 1 October and 3 who signed up in October and cancelled within weeks. It ends the month with 433.
- The cohort method is the cleanest: it measures what happened to the customers you had on day one. Track customers who leave in their first month separately, because that is an onboarding problem rather than a retention one.
- The second method is what Stripe Billing uses: churned subscribers in the past 30 days divided by active subscribers 30 days ago plus new subscribers in those 30 days.
- The last row mixes two groups: it counts losses from new customers but leaves the new customers out of the bottom of the sum. It overstates churn whenever you are growing.
- Any of the first three is defensible. Pick one, label it, and compare month to month on the same basis.
| Method | Working | Churn rate |
|---|---|---|
| Starting customers only (cohort) | 14 ÷ 400 | 3.50% |
| All losses over start plus new | 17 ÷ (400 + 50) | 3.78% |
| All losses over the average count | 17 ÷ ((400 + 433) ÷ 2) | 4.08% |
| All losses over start only (avoid) | 17 ÷ 400 | 4.25% |
Revenue churn: gross and net revenue retention
Revenue churn uses monthly recurring revenue (MRR) instead of customer counts. Start with the MRR you had from existing customers at the start of the month. Then measure what happened to that same group: revenue lost from cancellations, revenue lost from downgrades (contraction) and revenue gained from upgrades, extra seats or add-ons (expansion).
Gross revenue retention (GRR) shows how much of the starting revenue you kept, ignoring upgrades. It can never be above 100%. Net revenue retention (NRR) adds expansion back in. If existing customers upgrade by more than others cancel or downgrade, NRR goes above 100%, which is sometimes called negative churn: your customer base grows in value with no new customers at all.
Leave revenue from new customers out of both figures. Retention measures the customers you already had; new sales belong in a separate growth figure.
Gross revenue churn = (Churned MRR + Contraction MRR) ÷ Starting MRR Gross revenue retention = 100% − Gross revenue churn Net revenue retention = (Starting MRR − Churned MRR − Contraction MRR + Expansion MRR) ÷ Starting MRR
Worked example: a month of revenue churn
The salon booking app started October with $16,000 of MRR from its 400 customers, an average of $40 each. The 14 starting customers who cancelled paid $490 a month between them. Some salons moved to a cheaper plan, cutting $210 of MRR, while others added staff seats worth $900. The 47 new customers who stayed added $1,880.
- Customer churn was 3.5% on the cohort basis, but revenue churn before expansion was 4.4%. The salons that cancelled or downgraded were not only the smallest ones.
- Net revenue retention above 100% means the starting 400 customers paid $200 more in total at the end of the month than at the start, despite 14 of them leaving.
- Expansion can hide a churn problem, so watch gross retention on its own too.
| Figure | Working | Result |
|---|---|---|
| Starting MRR | 400 customers | $16,000 |
| Churned MRR | 14 cancellations | −$490 |
| Contraction MRR | Downgrades | −$210 |
| Expansion MRR | Extra seats and upgrades | +$900 |
| Gross revenue churn | ($490 + $210) ÷ $16,000 | 4.4% |
| Gross revenue retention | 100% − 4.4% | 95.6% |
| Net revenue retention | ($16,000 − $490 − $210 + $900) ÷ $16,000 | 101.3% |
| New MRR (not part of retention) | 47 customers × $40 | +$1,880 |
| Ending MRR | $16,000 − $490 − $210 + $900 + $1,880 | $18,080 |

Monthly vs annual churn: do not multiply by 12
Churn compounds. Each month you lose a share of the customers who are left, not of the customers you started the year with. So 3.5% a month is not 42% a year. After 12 months you keep 96.5% of 96.5% of 96.5%, and so on, which is 65.2% of the original group. Annual churn is the other 34.8%.
The conversion works in reverse too. If you know annual churn, perhaps because customers pay yearly, convert it to a monthly rate before using it in any monthly model. Our lifetime value calculator asks for monthly churn, so a business with 20% annual churn should enter about 1.84%, not 20% ÷ 12.
Annual churn = 1 − (1 − Monthly churn)^12 Monthly churn = 1 − (1 − Annual churn)^(1/12)
| Monthly churn | Annual churn (correct) | Monthly × 12 (wrong) | Average lifetime |
|---|---|---|---|
| 2% | 21.5% | 24% | 50 months |
| 3.5% | 34.8% | 42% | 28.6 months |
| 5% | 46.0% | 60% | 20 months |
| 8% | 63.2% | 96% | 12.5 months |
From churn to customer lifetime and LTV
If you lose a steady share of customers each month, the average customer stays for one divided by that share. At 3.5% monthly churn that is 1 ÷ 0.035, or about 28.6 months. Use the same time unit throughout: annual churn gives a lifetime in years.
Lifetime is what turns churn into money. Our customer lifetime value calculator multiplies monthly revenue per customer by gross margin and by this lifetime. For the salon app, $40 a month at an 80% gross margin over 28.6 months is a lifetime value of about $914 in gross profit. Cut churn to 2.5% and lifetime rises to 40 months, taking lifetime value to $1,280 without raising prices or winning a single extra customer.
The 1 ÷ churn shortcut assumes churn stays the same every month. In practice it is usually higher in the first few months and lower for customers who have stayed a year or more. Treat the lifetime as a planning figure, and recalculate it as your own history grows.
Average customer lifetime = 1 ÷ Churn rate Lifetime value = Monthly revenue per customer × Gross margin × Lifetime in months
Free toolCustomer lifetime value calculatorUse churn when you judge acquisition cost
Churn also changes how fast a new customer pays back what it cost to win them. A customer worth $32 a month in gross profit is not worth $384 in their first year, because some customers leave before month 12. At 3.5% monthly churn the average new customer is still paying for about 9.9 of their first 12 months, so expected first-year gross profit is about $318.
If you put that churn-adjusted figure into our customer acquisition cost calculator, a $250 CAC takes about 9.4 months to recover rather than the 7.8 months a full-year figure suggests. When churn is high, the gap grows, and spending that looked safe can tie up more cash than you planned.
Expected paying months in year one = (1 − (1 − Monthly churn)^12) ÷ Monthly churn
Free toolCustomer acquisition cost calculator