Key takeaways
- Conversion rate = Conversions ÷ the number of people or visits who had the chance to convert × 100. Choose clicks, sessions or visitors as the bottom number and never mix them.
- Cost per acquisition = Cost per click ÷ Conversion rate, so a better rate lowers what each sale costs without changing the ads.
- Break-even conversion rate = Cost per click ÷ Profit per order before ad costs. In our example, $0.90 clicks and $29.25 of profit per order need 3.08%.
- Small numbers are noisy: with about 40 orders a month, the rate can move by roughly a sixth from random chance alone.
The conversion rate formula
A conversion is the action you want someone to take: an order, a booking, a quote request, a sign-up. Conversion rate is the number of those actions divided by the number of chances people had to take them, shown as a percentage.
The top of the fraction is easy. The bottom is where most mistakes happen, because "visitors" can mean ad clicks, website sessions or individual people, and each gives a different answer. Google Ads, for example, divides conversions by ad interactions: 50 conversions from 1,000 interactions is 5%. Our ad cost calculator does the same with clicks.
Whichever count you use, use it every time. A rate based on sessions this month and on users next month will look like a change in performance when nothing changed but the maths.
Conversion rate = Conversions ÷ Clicks (or sessions, or visitors) × 100 Example: 42 orders ÷ 1,500 clicks × 100 = 2.8%
Free toolAd cost calculator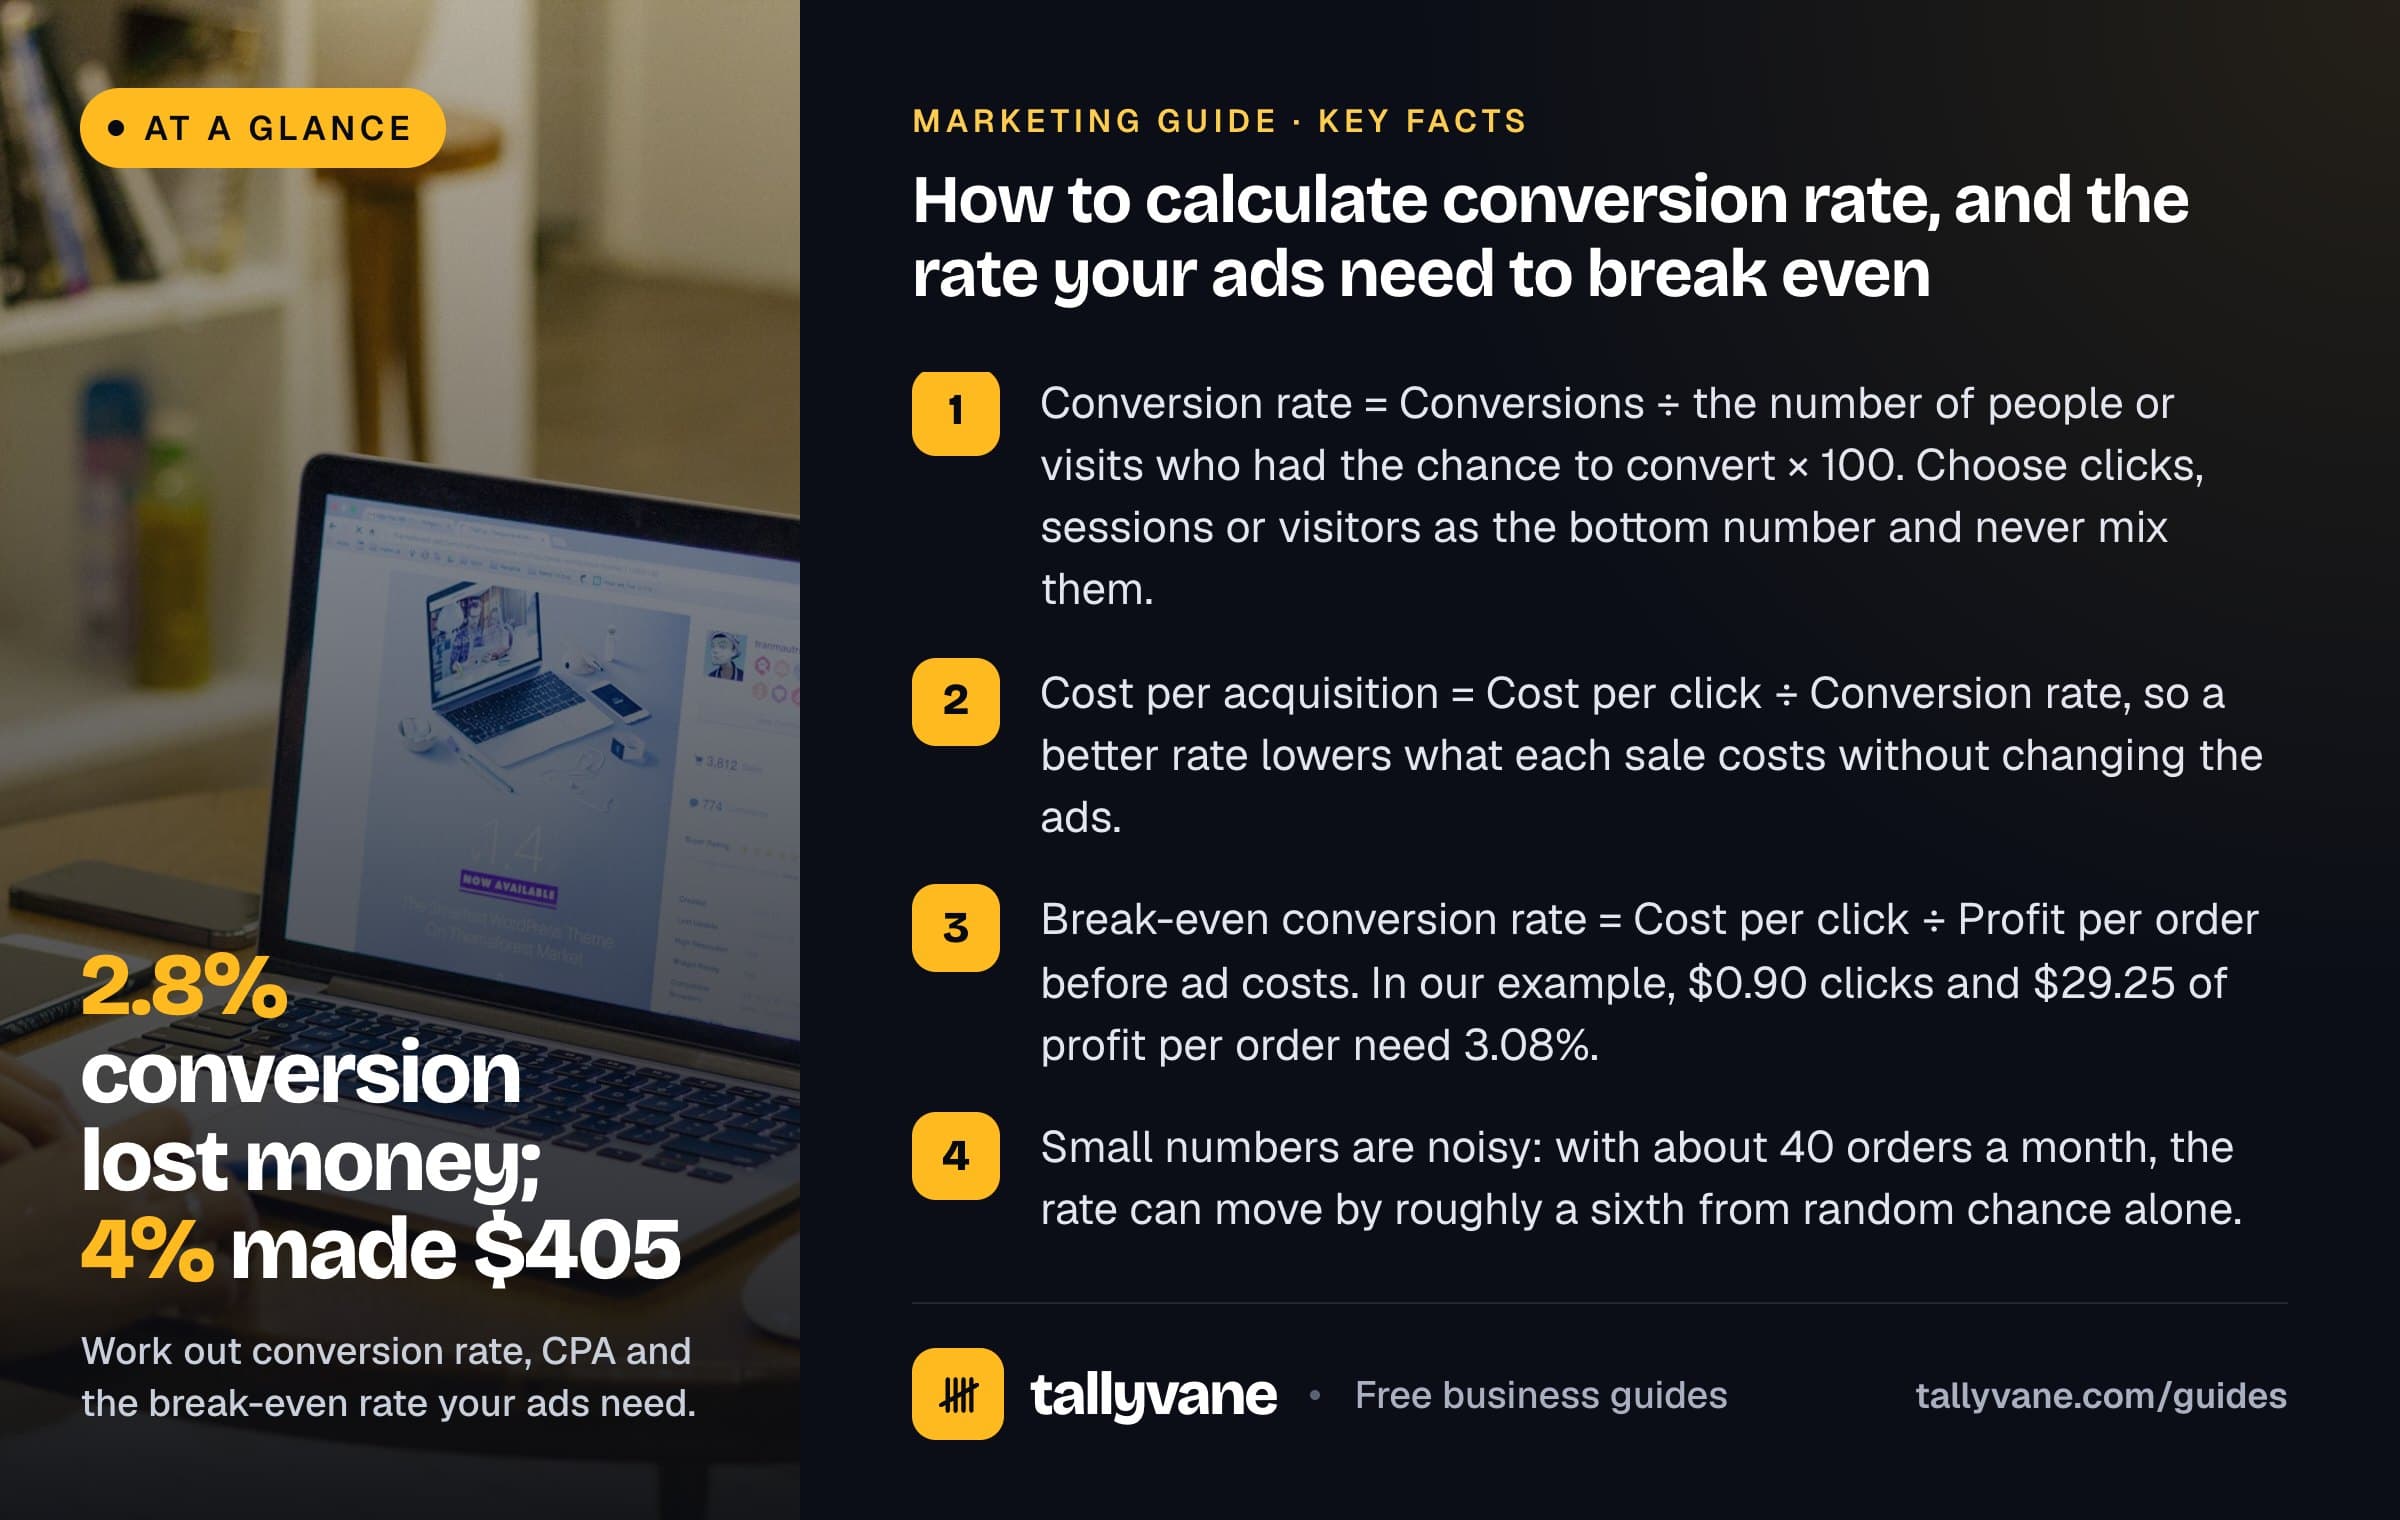
Clicks, sessions or visitors: which to divide by
Pick the bottom number by the question you are asking. To judge an ad campaign, divide by the clicks you paid for, because that is what links conversion rate to cost per click. To judge the website as a whole, divide by sessions or visitors from your analytics tool.
Google Analytics 4 calls the actions you count "key events" and reports a session key event rate: the sessions in which a key event happened, divided by total sessions. It also has a user-based rate. A shopper who visits three times before buying counts as one converting user but only one converting session out of three, so the user rate is usually the higher of the two.
| Bottom number | Best for | Watch out for |
|---|---|---|
| Ad clicks | Judging a campaign and working out cost per sale | Clicks and analytics sessions rarely match exactly |
| Sessions | Judging pages, checkout and the site overall | Repeat visits lower the rate even if the same people buy |
| Visitors (users) | Judging how many people you win over | Depends on cookies, so one person on two devices counts twice |
What counts as a conversion: online shops vs lead generation
For an online shop, count orders, not items and not revenue. A customer who buys three candles in one order is one conversion. Leave out test orders, and decide whether you count orders that are later refunded or cancelled. Counting only orders that stick is stricter, but it matches the money you keep.
For a service business, a conversion is usually a lead: a form, a call or a booking. A lead is not a sale, so track two rates and multiply them. If 600 clicks bring 36 quote requests and you win 9 of those jobs, your lead rate is 6%, your close rate is 25%, and only 1.5% of clicks become paying customers. That 1.5% is the figure to compare with your ad costs.
Count each lead once. A person who fills in the form and then phones should not count twice, and a spam form fill should not count at all.
Lead conversion rate = Leads ÷ Clicks × 100 Close rate = Customers won ÷ Leads × 100 Click-to-customer rate = Lead conversion rate × Close rate Example: 6% × 25% = 1.5%
Worked example: a pet supplies shop
An online pet supplies shop spends $1,350 on search ads in a month and gets 1,500 clicks, so it pays $0.90 a click. The ads bring in 42 orders. The average order is $65, and after product cost, packaging, shipping and payment fees the shop keeps 45% of each order before ad costs, or $29.25.
- At 2.8% each order costs $32.14 in ads but earns only $29.25, so the month lost $121.50 on first orders.
- The shop needs 3.08%, or about 47 orders from the same 1,500 clicks, just to break even.
- Lifting the rate to 4% with the same spend and clicks gives 60 orders, a $22.50 cost per acquisition and $405 of profit. The ads did not change; the page and offer did.
| Figure | Working | Result |
|---|---|---|
| Cost per click | $1,350 ÷ 1,500 | $0.90 |
| Conversion rate | 42 ÷ 1,500 × 100 | 2.8% |
| Cost per acquisition | $0.90 ÷ 2.8% | $32.14 |
| Profit per order before ads | $65 × 45% | $29.25 |
| Break-even conversion rate | $0.90 ÷ $29.25 | 3.08% |
| Profit after ads at 2.8% | 42 × $29.25 − $1,350 | −$121.50 |
| Profit after ads at 4.0% | 60 × $29.25 − $1,350 | $405.00 |
From conversion rate to cost per acquisition and break-even
Cost per acquisition (CPA) is cost per click divided by conversion rate. It is the same as total spend divided by conversions, and our ad cost calculator works it out either way. The formula matters because it shows the lever: halve the conversion rate and you double what each sale costs, even if your clicks get no more expensive.
Turn that around and you get the break-even conversion rate. The most you can pay for an order is the profit it earns before ad costs. Divide your cost per click by that profit and you have the lowest conversion rate at which the ads pay for themselves. Below it, every extra click loses money.
This is the same test as break-even ROAS, seen from the other side. At 3.08% the pet shop’s ads return $2.22 of revenue per $1 spent, which is exactly 1 ÷ 45%. Use whichever number you track; our break-even ROAS guide covers the return-on-ad-spend view, and our CPM vs CPC vs CPA guide shows how click-through rate fits into the same chain.
CPA = CPC ÷ Conversion rate Break-even conversion rate = CPC ÷ Profit per order before ad costs Example: $0.90 ÷ $29.25 = 3.08%
Free toolROAS calculator
Small numbers make noisy rates
A conversion rate built on a handful of orders moves a lot from pure chance. A rough rule of thumb: the normal random swing in a count of conversions is about its square root. Ten orders could easily have been seven or thirteen with no real change in your site or ads.
The pet shop’s 42 orders have a typical swing of about 6.5. Next month, with nothing changed, the rate could easily read anywhere from about 2.4% to 3.2%, a range that sits on both sides of its 3.08% break-even. One month of data cannot tell the shop whether its ads truly lose money; two or three months, or a bigger change in the rate, can.
- Judge rates over enough time to collect at least a few dozen conversions, and more for small differences.
- When you test two versions of a page, a difference of a quarter (say 2% against 2.5%) usually needs a few hundred conversions on each version before you can trust it.
- Do not compare a week that included a sale or holiday with an ordinary week.
| Conversions in the period | Typical swing (square root) | Swing as a share of the rate |
|---|---|---|
| 10 | About 3 | About 32% |
| 25 | 5 | 20% |
| 100 | 10 | 10% |
| 400 | 20 | 5% |
How to improve your conversion rate
Most gains come from removing reasons to leave. Start with whatever stands between the click and the order, and change one thing at a time so you can see what worked.
- Match the page to the ad. If the ad promises a product or price, land people on that product at that price, not your home page.
- Show the full cost early. Shipping charges that appear only at checkout are a common reason people abandon a cart.
- Make the page fast and easy to use on a phone, where much of your traffic arrives.
- Cut checkout and form fields to the minimum, and offer guest checkout.
- Answer doubts on the page: reviews, clear photos, delivery times and a plain returns policy.
- For leads, reply fast. A quote request answered the same day is more likely to become a job, which lifts your close rate.
- Track the result in money, not just percentages: a higher rate that comes from a deep discount can still lower profit per order.