
Key takeaways
- Across 5,994 US public companies in Aswath Damodaran’s January 2026 dataset, the average gross margin was 37.76% and the average net margin 9.74%.
- Margins vary hugely by industry: grocery retail ran a 26.31% gross and 1.32% net margin, while system and application software ran 71.72% gross and 25.49% net.
- Compare gross margin with businesses that sell the same kind of thing, and operating margin with businesses run the same way. Net margin is the least comparable.
- For a small business, subtract a fair wage for the owner’s work before comparing with company benchmarks, or your margin will look better than it is.
- The best benchmark is the margin your own business needs: operating costs, owner pay and target profit, divided by revenue.
The short answer
There is no single good profit margin. A 2% net margin is normal for a supermarket and a disaster for a software company. What counts as good depends on your industry, on which of the three margins you are looking at, and on how much profit your business needs to pay its owner and keep going.
Still, a reference point helps. Aswath Damodaran, a finance professor at NYU Stern School of Business, publishes margins by industry for US public companies every January. His January 2026 update covers 5,994 companies. Across all of them, the gross margin was 37.76% and the net margin 9.74%. Leave out banks, insurers and other financial firms and the figures are 34.39% and 8.56% across 4,822 companies.
If you need a refresher on how each margin is calculated, our guide to calculating profit margin covers the formulas. This guide is about what the results mean.
Free toolProfit margin calculator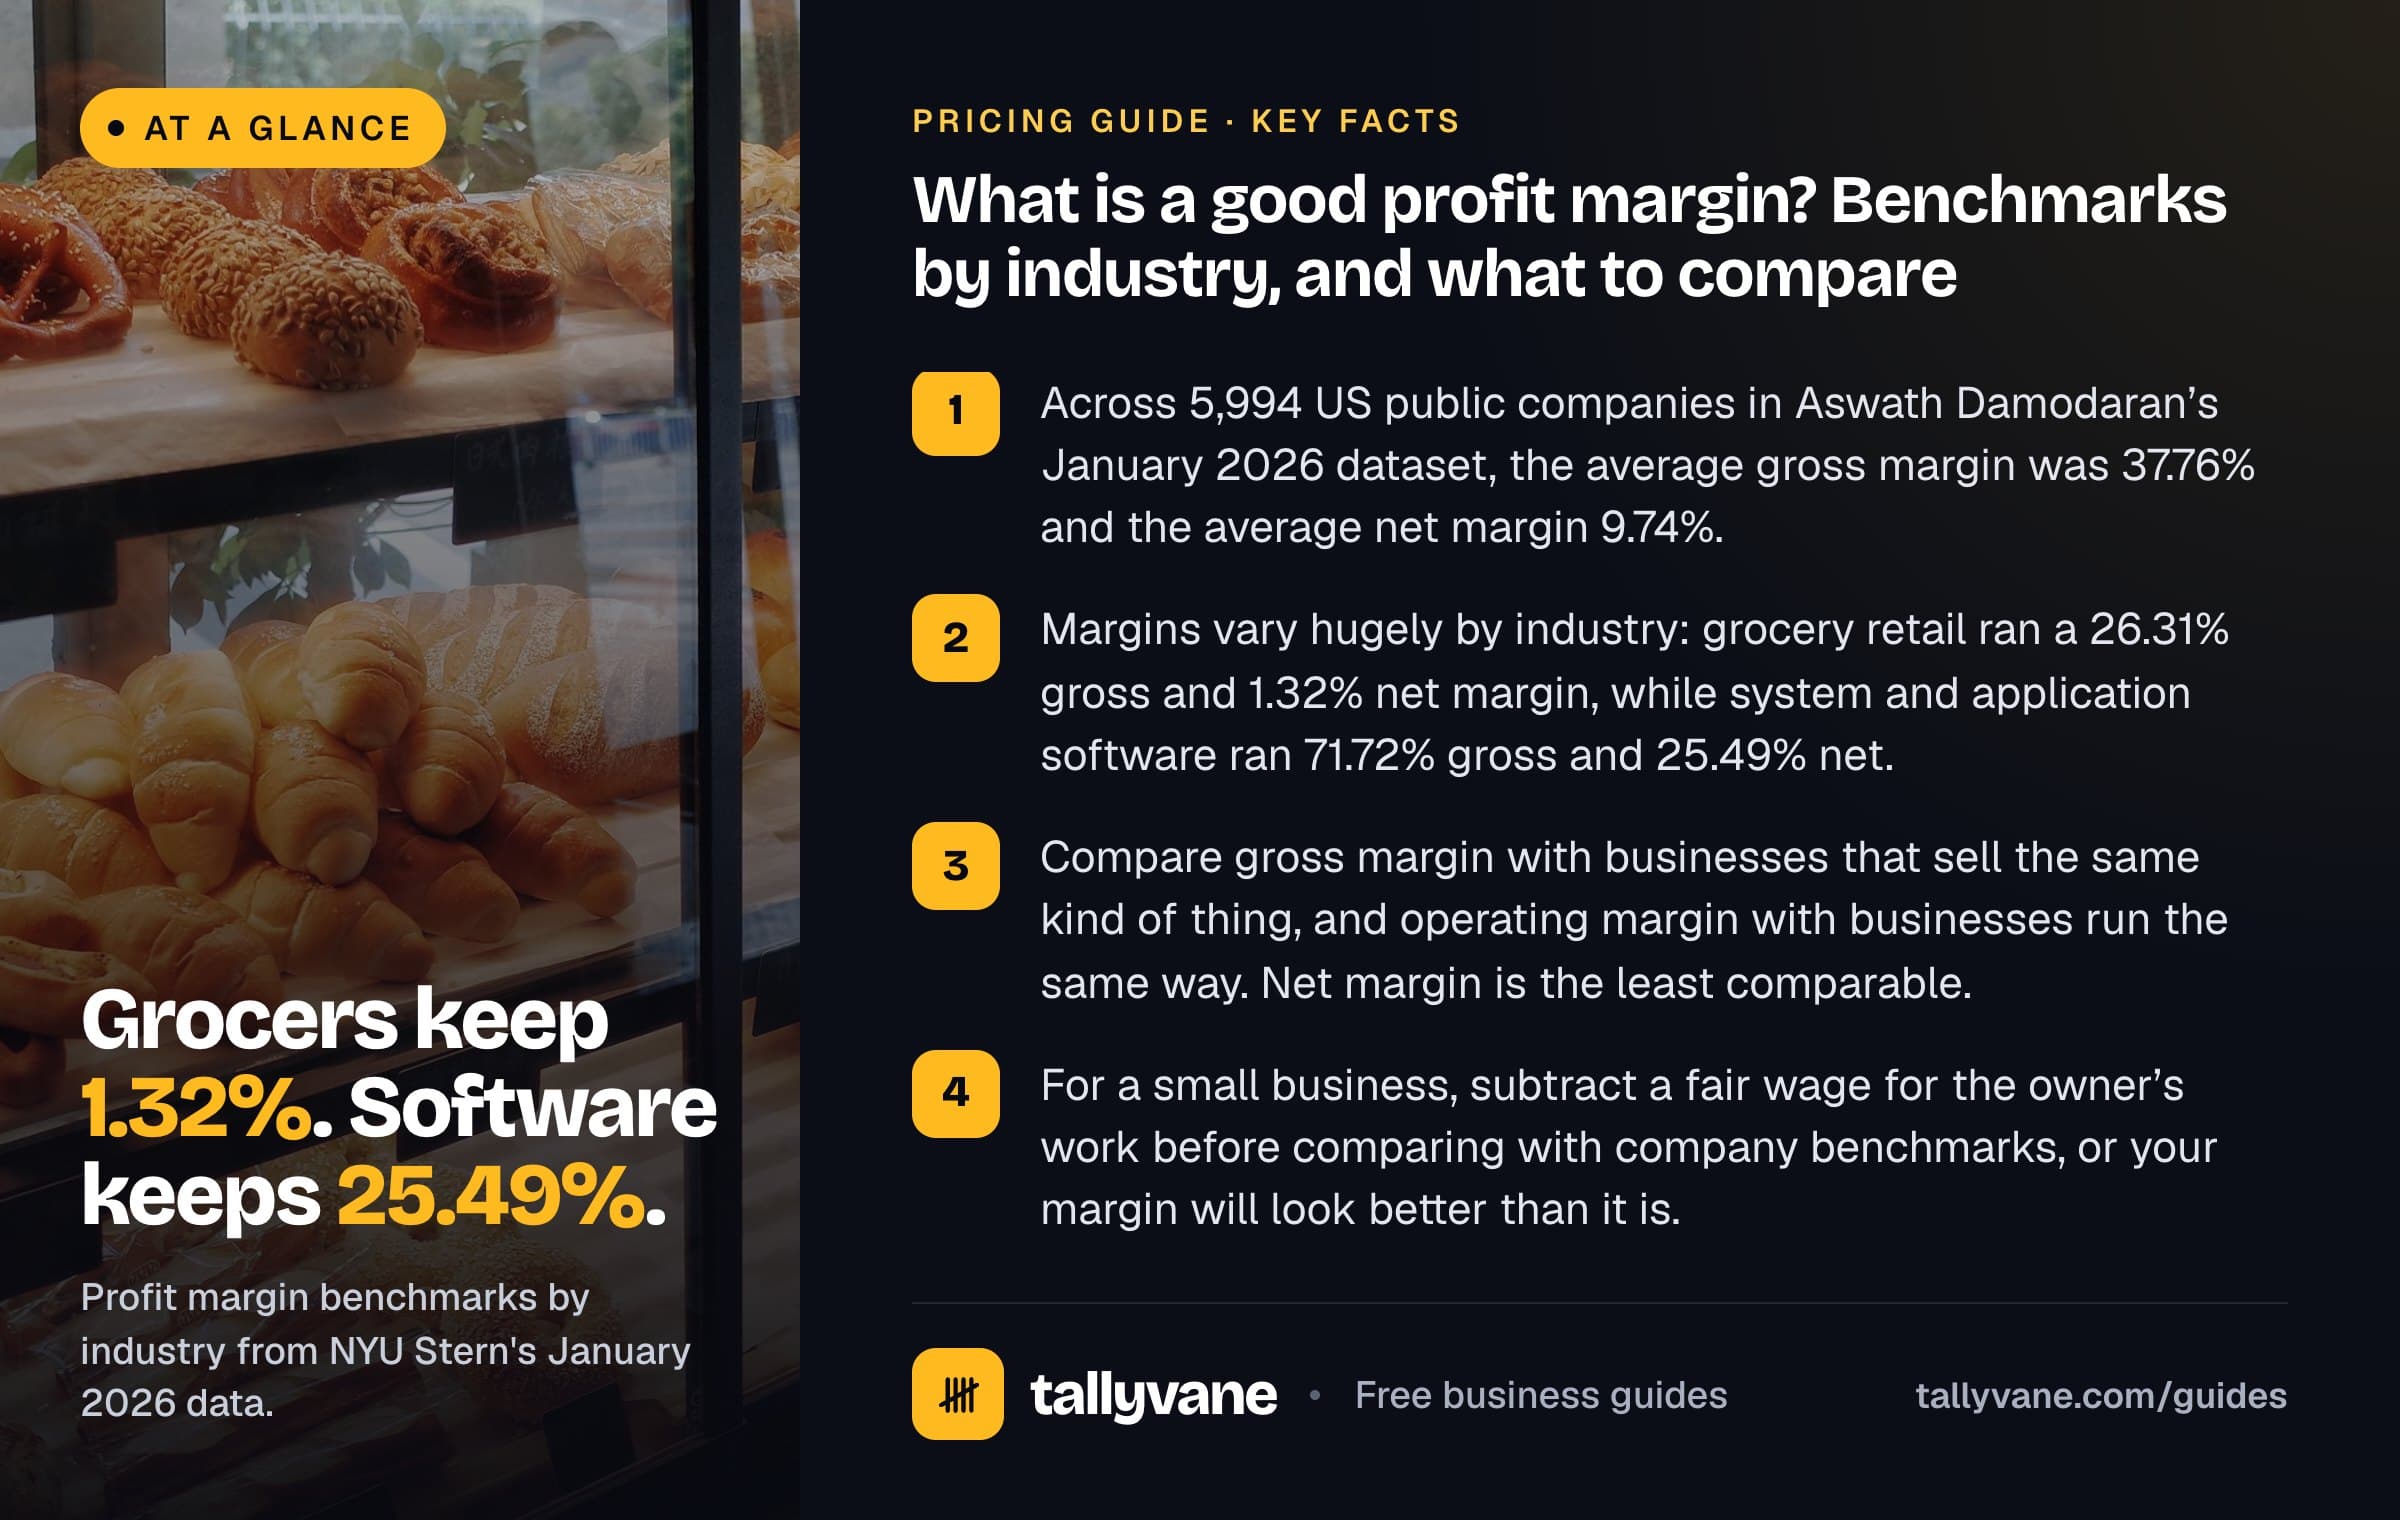
Profit margin benchmarks by industry
The table shows industries closest to the kinds of businesses small owners run, quoted exactly from the dataset. Operating margin here is Damodaran’s pre-tax, unadjusted operating margin. Firms is the number of companies in each group.
- Net margin includes one-off gains and losses, interest and tax, so it can swing in a single year. Advertising shows a small net loss despite a 10.07% operating margin. Operating margin is the steadier figure to compare.
- These are listed companies, usually far larger than a small business, and many run several lines of business at once. Read them as a guide to the shape of an industry, not a target to hit to the decimal.
| Industry | Firms | Gross margin | Operating margin | Net margin |
|---|---|---|---|---|
| Retail (Grocery and Food) | 15 | 26.31% | 2.29% | 1.32% |
| Retail (General) | 23 | 33.18% | 6.80% | 5.61% |
| Retail (Special Lines) | 94 | 35.30% | 7.73% | 5.19% |
| Apparel | 35 | 56.88% | 9.11% | 3.85% |
| Food Wholesalers | 13 | 15.44% | 2.61% | 1.17% |
| Restaurant/Dining | 64 | 32.24% | 15.79% | 9.37% |
| Business & Consumer Services | 155 | 33.38% | 12.27% | 7.03% |
| Computer Services | 64 | 24.26% | 7.41% | 4.45% |
| Advertising | 52 | 36.24% | 10.07% | −0.30% |
| Engineering/Construction | 48 | 15.46% | 6.49% | 5.94% |
| Trucking | 26 | 21.19% | 6.89% | 3.79% |
| Software (System & Application) | 309 | 71.72% | 32.98% | 25.49% |
| Total market | 5,994 | 37.76% | 12.82% | 9.74% |
Why margins differ so much: retail, software and restaurants
Retailers buy finished goods and resell them, so most of each sale goes straight back to the supplier. Grocery is the extreme case: a 26.31% gross margin shrinks to a 1.32% net margin once stores, staff and distribution are paid. Grocers make money on volume and on how fast their stock sells, not on margin per sale.
Software is the opposite. An extra copy or subscriber costs very little to serve, so gross margin is high, 71.72% for system and application software. But most of the cost sits further down, in developers, sales and marketing, which is why the 25.49% net margin is far below the gross figure.
Restaurants sit in between, with a 32.24% gross margin in the dataset. Treat their 9.37% net margin with care: the public group includes large chains that earn much of their income from franchise fees, which carry little cost. An independent restaurant pays for its own food, staff and rent on every plate.
Two more things move the figures. Where a company puts a cost, in cost of goods sold or in overheads, changes its gross margin without changing its profit. And businesses that need a lot of equipment or stock generally need a higher margin to earn a fair return on the money tied up in them.
What to compare your margin with
Use each margin for the comparison it suits. Gross margin tells you about pricing and buying, so compare it with businesses that sell similar goods in a similar way. Operating margin tells you how lean the business is, so compare it with businesses of a similar model. Net margin depends on loans and tax, so compare it mostly with your own past years.
For a small business, the biggest trap is owner pay. A sole trader or partnership usually pays the owner from profit, not salary, so the profit on the books includes the owner’s wages. Public companies pay their managers salaries before profit. Before you compare, subtract what it would cost to hire someone to do your job.
- Your own history: the same margin for the same months last year, and its trend over three years.
- Close peers: trade association surveys, your accountant’s client data, or published accounts of similar private firms where they are available.
- Public-company benchmarks such as the table above, for the general shape of the industry.
- The margin your business needs, worked out below. This is the only one that tells you whether you can pay yourself and keep going.
Worked example: a gift shop against the benchmark
A gift shop has $400,000 of sales in a year. The goods it sold cost $236,000. Rent, staff, card fees, software and marketing come to $118,000. The owner works full time in the shop and takes no salary. Hiring a manager to do the same work would cost about $40,000. The closest benchmark is Retail (Special Lines).
- The shop’s gross margin beats the benchmark by almost 6 points, so its buying and pricing are not the problem.
- Before owner pay, the shop looks more profitable than listed retailers. After paying for the owner’s work, it earns only 1.5%, well below them.
- Overheads are the issue: $118,000 is 29.5% of sales. More sales from the same shop, or lower costs, would do more than squeezing suppliers.
| Line | Gift shop | Margin | Benchmark margin |
|---|---|---|---|
| Revenue | $400,000 | ||
| Cost of goods sold | −$236,000 | ||
| Gross profit | $164,000 | 41.0% | 35.30% |
| Operating expenses (no owner salary) | −$118,000 | ||
| Operating profit before owner pay | $46,000 | 11.5% | 7.73% |
| Fair wage for the owner’s work | −$40,000 | ||
| Operating profit after owner pay | $6,000 | 1.5% | 7.73% |

Work out the margin your business needs
Benchmarks tell you what others earn. To know what you need, add your operating expenses, a fair wage for your own work and the profit you want to keep for savings, tax and growth, then divide by your expected sales. The result is the gross margin you must reach on average.
For the gift shop, wanting $20,000 of profit after paying the owner: ($118,000 + $40,000 + $20,000) ÷ $400,000 = 44.5%. Its current 41% is 3.5 points short. A 44.5% margin is an 80.2% markup on cost, so an item that costs $17.70 needs to sell for about $31.89 instead of $30.
Gross margin needed = (Operating expenses + Owner pay + Target profit) ÷ Expected revenue
Free toolMarkup calculatorHow to improve your profit margin
Small changes add up. Each point of gross margin on $400,000 of sales is $4,000 a year. If the gift shop lifted its gross margin from 41% to 43%, gross profit would rise by $8,000 and its operating profit after owner pay from $6,000 to $14,000.
- Raise prices where your value supports it, starting with new products and best sellers. Our guide on how to raise prices shows how many sales a rise can afford to lose.
- Cut cost of goods: negotiate with suppliers, buy in larger lots where stock sells reliably, and reduce waste, damage and returns.
- Change the mix: promote high-margin products and services, and rethink or drop those that barely cover their cost.
- Check every per-sale cost: card and marketplace fees, packaging and free shipping thresholds.
- Grow sales faster than overheads. Rent and many salaries do not rise with each sale, so more revenue from the same base lifts operating margin.
- Review margins monthly from your profit and loss statement, so a slipping margin shows up within weeks rather than at year end.